







Power BI vs Excel for Dynamics 365 Reporting: When to Use Financial Reports, SSRS and AI Analytics
A CFO dashboard, a statutory Profit & Loss statement, a fifteen-thousand-row reconciliation and a printed customer invoice are four different problems. Choosing one reporting tool for all four is what makes reporting projects fail.
- Reporting
- Urewa Editorial
- Practical guide
- 15 min read
- 2026
Contents
Business reporting in Microsoft Dynamics 365 is not simply a choice between Power BI and Excel. A finance manager may need a structured Profit & Loss statement. A CFO may want an interactive dashboard showing working capital, revenue, cash flow and receivables. An accountant may need to reconcile thousands of transactions. A warehouse manager may need an operational inventory listing. A customer may require a formatted invoice. And an executive increasingly wants to ask questions about business performance in plain English.
Each requirement is different. That is why organisations running Microsoft Dynamics 365 Finance and related business applications should think in terms of a reporting strategy, rather than trying to select one reporting tool for every requirement.
The question is not “is Power BI better than Excel?” The better question is “which reporting technology is most appropriate for this business requirement?”
01The LandscapeDynamics 365 reporting is more than Power BI vs Excel
Excel and Power BI are both extremely valuable. Excel remains one of the most practical tools for detailed calculations, reconciliations, ad-hoc analysis and working directly with transactional data. Power BI is designed for interactive analytics, dashboards, visualisations, trends and management-level insight.
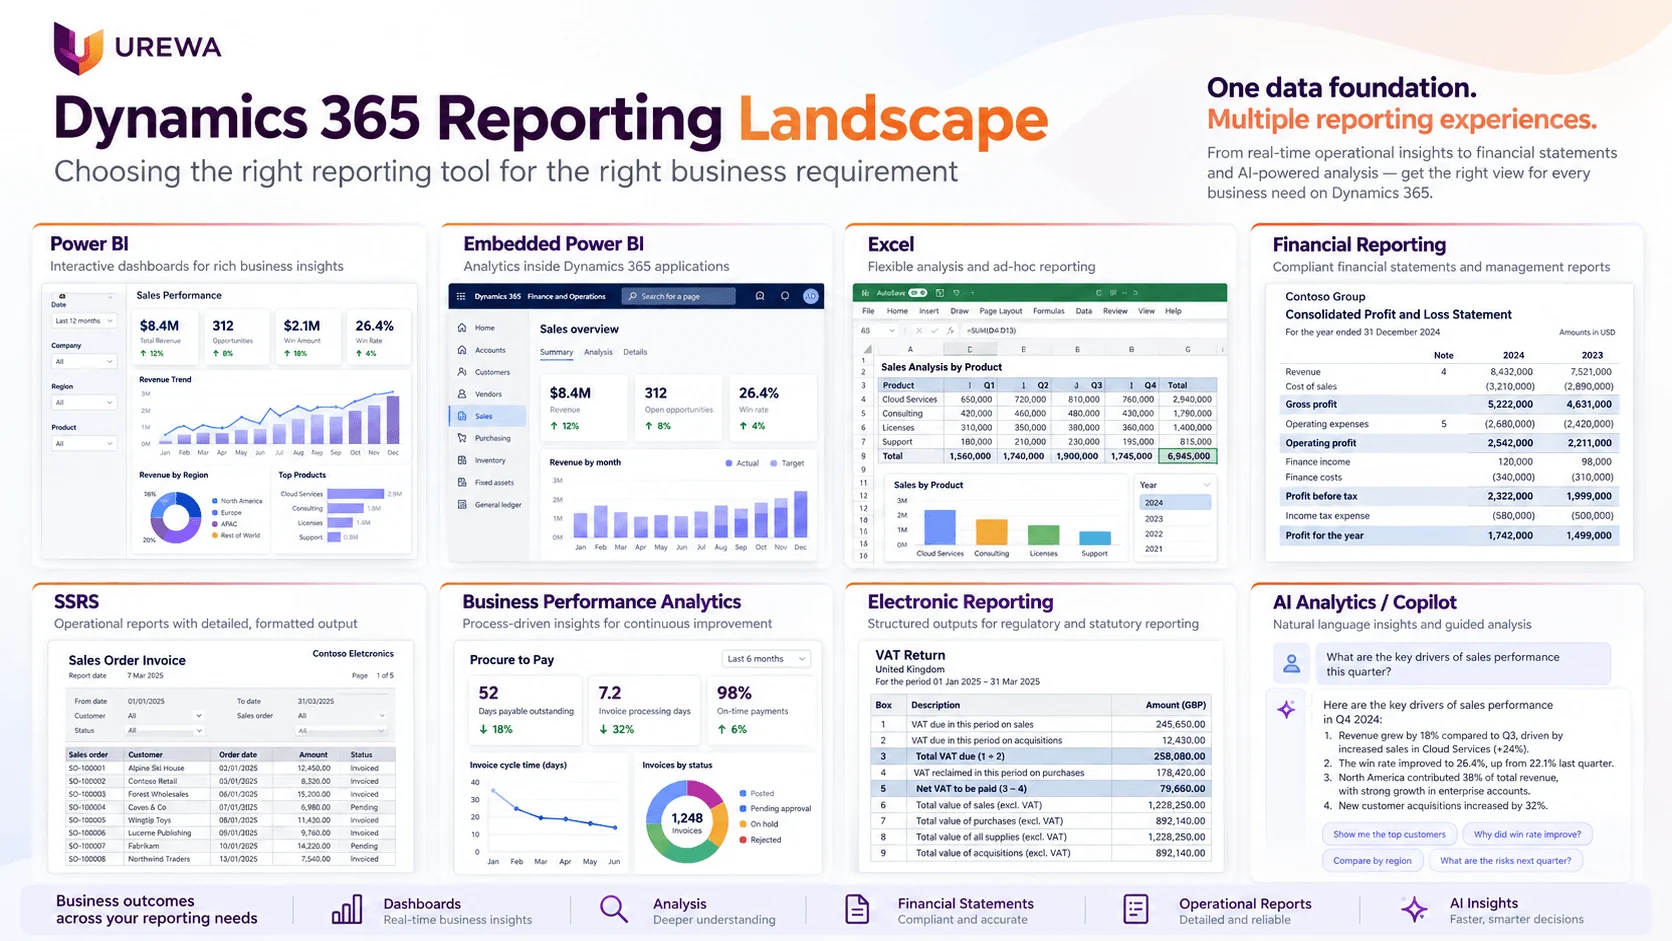
But Dynamics 365 reporting does not stop there. Finance and Operations applications also support Financial Reporting for structured financial statements, SSRS-based reporting for operational and precision-layout requirements, Business Performance Analytics for standardised analytical models, and Electronic Reporting for structured regulatory and electronic outputs. More recently Microsoft has introduced AI-based analytical capabilities that let agents query Business Performance Analytics data using natural language — currently documented as preview, so it should be treated as an emerging capability rather than a replacement for established reporting tools.
The landscape therefore looks more like this:
| Business requirement | Reporting option |
|---|---|
| Executive dashboard and KPI monitoring | Power BI |
| Analytics directly inside Dynamics 365 | Embedded Power BI |
| Detailed reconciliation and ad-hoc analysis | Excel |
| P&L, Balance Sheet and structured statements | Financial Reporting |
| Operational and precision-format documents | SSRS |
| Standardised finance and process analytics | Business Performance Analytics |
| Regulatory and electronic output formats | Electronic Reporting |
| Natural-language analytical questions | AI / ERP Analytics MCP |
There is no single winner. The right answer depends on the business question.
02Interactive AnalyticsPower BI: interactive analytics and executive dashboards
Power BI is generally the strongest option when users need to understand trends, compare performance, interact with data and monitor KPIs. Instead of reading rows of transactions, decision-makers explore information visually.
A CFO dashboard might show revenue, gross margin, EBITDA, operating expenses, cash position, overdue receivables, working capital, budget variance and entity performance. A supply-chain dashboard might show inventory turns, stock ageing, supplier performance, purchase lead times, warehouse activity, demand trends and service levels. A manufacturing dashboard could analyse production output, scrap, consumption variance, plan versus actual and inventory availability.
The real benefit is not that the charts look better. The benefit is interaction. A manager selects a company, site, department, product, date range or customer, and every visual responds to that context. That makes Power BI particularly useful for questions such as:
- Why did our gross margin fall this month?
- Which products are driving the increase in inventory?
- Which customers contribute most to overdue receivables?
- Which plants are experiencing the highest production variance?
Power BI helps management move from simply viewing numbers to investigating the story behind them.

03In ContextEmbedded Power BI: analytics without leaving Dynamics 365
Power BI does not always need to run as a separate application. Dynamics 365 Finance and Operations can surface Power BI analytics directly inside application workspaces — interactive reporting experiences where users view KPIs and visuals and drill into application details.
This matters because business users usually want analytics in the context of the process they are already performing. Consider a procurement manager. Rather than opening a separate BI application, the procurement workspace shows supplier performance, overdue purchase orders, purchase-price variance, delayed deliveries and procurement trends. The manager spots an issue and moves from insight to transaction to action without losing context.
Analytics that sit next to the transaction get acted on. Analytics that live in a separate application get looked at once a month.
04Still EssentialExcel: still essential for Dynamics 365 users
Power BI has not made Excel obsolete. For many Dynamics 365 users, Excel remains the most productive tool available — for financial reconciliation, transaction investigation, budget preparation, pivot-table analysis, temporary calculations, what-if modelling, detailed account analysis and bulk data review.
Consider a finance controller who needs to investigate fifteen thousand vendor transactions. Building a new Power BI dashboard is rarely the fastest answer. The controller needs to open the relevant data in Excel, filter it, create pivots, add calculations, reconcile totals and find the exception. Excel is extremely effective for exactly that.
Dynamics 365 also supports Excel remaining connected to application data through the Excel and OData integration, rather than being only a static export. Microsoft distinguishes Open in Excel, which can stay connected and allow supported changes to be published back, from a plain export of information — a distinction worth knowing before anyone builds a manual upload process around it.
So the practical message is: Power BI is not a replacement for Excel. It solves a different reporting problem.
05Worked ExamplePower BI vs Excel: a practical Dynamics 365 example
Imagine a finance team reviewing operating expenses. The CFO wants to know which departments are exceeding budget and what trend is developing. Power BI is well suited to that requirement.
The accountant then discovers that one department is significantly above budget, and now wants to inspect hundreds of underlying transactions, categorise them, reconcile several entries and perform temporary calculations. Excel is the better tool for that stage.
Power BI helps identify where to investigate. Excel often helps perform the investigation. The two complement each other rather than competing.
06StatementsFinancial Reporting: when the requirement is a financial statement
Some reporting requirements are not dashboards at all. A CFO simply says:
- “I need our monthly Profit & Loss statement.”
- “Give me the Balance Sheet by company and department.”
- “Show Actual versus Budget with the same row structure we use every month.”
Those requirements are different from interactive business intelligence. Dynamics 365 Finance includes Financial Reporting, designed specifically for structured financial statements, and ships with a collection of default reports — including the traditional Income Statement and Balance Sheet — that organisations can use or adapt.
Typical requirements include Profit & Loss (revenue, cost of sales, gross profit, operating expenses, EBITDA, net profit), Balance Sheet (assets, liabilities, equity), Budget versus Actual, department P&L, cost-centre reporting, entity comparison, consolidated management reporting and financial-dimension reporting.
The strength of Financial Reporting is structure. Finance teams need consistent rows, columns, account structures, periods and organisational dimensions — every period, without drift. Power BI can certainly visualise financial information, but that does not mean every formal financial statement should become a Power BI project.
Power BI vs Financial Reporting
Power BI is best when the question is “what is happening, why, and where should we investigate?” Financial Reporting is best when the requirement is “produce this statement in this defined financial structure.” Both matter to the same CFO. They serve different purposes.
07DocumentsSSRS: operational and precision-layout reporting
SSRS-based reporting remains important in Dynamics 365 Finance and Operations. Microsoft’s document reporting services use SQL Server Reporting Services technology and support operational and document scenarios — scheduled execution, email delivery, print archives, parameterised reporting and precision documents.
Typical outputs include purchase orders, sales invoices, packing slips, customer statements, transactional listings, operational reports, production documents and custom business reports. SSRS becomes particularly useful when the user needs a controlled output rather than exploratory analytics.
A Power BI dashboard may tell a procurement manager that purchasing volume increased by 18 per cent. An SSRS report provides the detailed purchase transactions that support the operational review. These are not competing functions.
Power BI vs SSRS
Power BI helps users analyse information. SSRS helps users present operational or detailed information in a controlled format. Power BI is optimised for exploration; SSRS is better suited when layout, parameters, transaction detail or formatted output are central to the requirement.
08Governed ModelsBusiness Performance Analytics: a newer analytics layer
Dynamics 365 Finance now includes Business Performance Analytics, an analytics solution for financial and operational information. Current standard reporting areas follow business processes — Record-to-Report, Procure-to-Pay and Order-to-Cash — and the reports use Power BI data models, so stakeholders can filter, slice and drill into performance data.
More importantly, it does not force the organisation to choose between Power BI and Excel. Microsoft allows reports to be created from Business Performance Analytics data using either, and provides an Excel add-in that exposes the same dataset used by the embedded Power BI reports.
The useful architecture is not Excel versus Power BI. It is one governed analytical foundation, with different reporting experiences on top of it depending on the user.
In practice that means:
- For a CFO — Record-to-Report: financial performance, Actual versus Budget, profitability and account analysis.
- For procurement — Procure-to-Pay: purchasing performance, supplier analysis, procurement activity and vendor performance.
- For sales and finance — Order-to-Cash: sales performance, invoicing, receivables and customer activity.
That structure provides a far stronger foundation than independently building dozens of disconnected spreadsheets.

09RegulatoryElectronic Reporting: not every report is an analysis
Another technology Dynamics customers sometimes confuse with BI is Electronic Reporting. It is not intended for management dashboards. Microsoft positions it as a configurable framework for creating and maintaining regulatory electronic reporting and payment formats, using configuration rather than traditional custom code for many scenarios.
This matters because a requirement phrased as “we need a report for the bank” may not be a Power BI, Excel or SSRS requirement at all. The correct technology may be Electronic Reporting. The first step is always to understand what the output will be used for — and by whom.
10EmergingAI and Copilot: the next layer of Dynamics 365 analytics
AI is starting to change how users interact with business data. Traditionally a user would run a report, export the data, filter it, calculate and interpret. An AI-assisted experience introduces another possibility: ask a business question in natural language and let the analytical layer work out how to answer it.
Microsoft currently documents Dynamics 365 ERP Analytics MCP as a preview capability enabling AI agents to access Business Performance Analytics data using natural-language questions, dynamically generating and executing analytical queries while respecting the authenticated user’s security context. Microsoft also documents connecting that capability to agent platforms such as Copilot Studio.
Conceptually a user could ask:
- Which vendors have shown declining delivery performance?
- Which product categories are showing declining sales?
- Where has operating expense increased significantly?
Organisations should understand one distinction, though. AI is not a replacement for governed reporting. A board-approved P&L still needs financial controls. An invoice still requires a controlled document format. A statutory output still requires its regulatory structure. An operational report still requires transaction-level precision. AI adds an interaction layer over trusted analytical information — and that is where its value becomes significant.
11Decision TableWhich Dynamics 365 reporting tool should you use?
| Business requirement | Tool | Why |
|---|---|---|
| CFO wants interactive company performance | Power BI | KPIs, trends and drill-down |
| Procurement manager wants supplier KPIs inside Dynamics | Embedded Power BI | Insight in operational context |
| Accountant needs to reconcile thousands of transactions | Excel | Flexible detailed analysis |
| Finance needs monthly P&L and Balance Sheet | Financial Reporting | Structured financial statements |
| User needs a formatted invoice or operational document | SSRS | Precision and transactional output |
| Management wants standardised process analytics | Business Performance Analytics | Governed analytical models |
| Business needs an electronic regulatory or payment file | Electronic Reporting | Structured electronic formats |
| Executive wants natural-language analytical insight | AI / ERP Analytics MCP | Conversational analytics, where appropriate |
Do not select the reporting technology first. Define the reporting requirement first.
12Real ScenariosReal Dynamics 365 reporting scenarios
Finance
A finance team may simultaneously use Financial Reporting for P&L and Balance Sheet, Excel for reconciliations and transaction investigation, Power BI for management dashboards, Business Performance Analytics for broader analytical reporting, and SSRS for transaction listings and controlled operational output. There is nothing wrong with five technologies if each is solving the correct problem.
Supply chain
A supply-chain director may use Power BI for inventory value, stock ageing, inventory turns, supplier performance and purchase lead times. A warehouse supervisor needs something entirely different: item, warehouse, location, quantity, batch, serial number and physical availability. The first requirement is analytical; the second is operational. Using the same technology for both because “Power BI is our reporting tool” is not good solution architecture.
Manufacturing
A plant manager may need a dashboard covering production output, efficiency, scrap, material consumption and plan versus actual. A production supervisor needs a detailed operational report with production orders, routes, quantities and transaction-level information. A dashboard is not an operational report.
Executive management
Executives usually benefit most from simplification. They do not want twenty reports. They want to know what changed, why it changed, where attention should go and what action is required. That is where Power BI and, increasingly, AI-assisted analytical experiences become particularly valuable.
13GovernanceWhy reporting projects often fail
Businesses sometimes assume reporting is a matter of creating charts. The harder problem is usually the data:
- Different departments defining the same KPI differently
- Multiple Excel versions in circulation, each containing different numbers
- Weak or inconsistent financial dimensions
- Incorrect master data underneath otherwise correct visuals
- Reports built around individual users rather than business processes
- The same calculation recreated independently in a dozen dashboards
- No clear ownership of reporting data
- Reports created without considering security or row-level access
This leads to an uncomfortable situation: more reports, but less trust in the numbers. A successful Dynamics 365 reporting strategy therefore requires both technology and governance.
One version of the truth does not mean one report
Organisations often say they need one version of the truth. That does not mean every user must use the same report. A CFO, an accountant, a warehouse manager and a CEO need different reporting experiences. What should stay consistent is:
- Master data
- Business definitions
- KPIs
- Financial dimensions
- Calculation logic
- Security model
- The underlying governed data
From that common foundation, different reporting tools can serve different users. It is a much healthier architecture than trying to replace every workbook and every operational document with one enormous dashboard.
14MethodHow to design a Dynamics 365 reporting strategy
We recommend starting with business questions rather than reporting tools. The first question is always: who needs this information, and what decision will they make with it? Then work through:
- Is the requirement analytical or transactional?
- Does the user need to edit or manipulate the data?
- Does the output require a fixed, controlled format?
- Does the information need to be interactive?
- How frequently does the underlying data change?
- Does the report combine multiple data sources?
- Does it need regulatory or statutory formatting?
- Does it require financial-statement row and column structures?
- Does the user need the information inside Dynamics 365 itself?
- Is AI-assisted exploration appropriate for this audience?
Only once those answers are clear should the reporting technology be selected.
How Urewa approaches Dynamics 365 reporting
| Layer | What happens |
|---|---|
| Business requirement | We start with the business question, the target users, the decision being made and the outcome expected — not with a tool. |
| Data foundation | We review the underlying Dynamics 365 data, master data, financial dimensions, entities, external sources and reporting ownership. |
| Reporting architecture | We decide whether the requirement belongs in Power BI, embedded analytics, Excel, Financial Reporting, SSRS, Business Performance Analytics or Electronic Reporting. |
| Security and governance | Reports respect user access, organisational structures, financial controls and data-governance requirements. |
| Adoption | A technically excellent dashboard is worth nothing if users keep preparing the same numbers manually. Reporting is designed around how people actually work. |
This is the same discipline we apply during a Dynamics 365 implementation, where reporting is designed alongside the process rather than bolted on after go-live.
Power BI vs Excel: so which one is better?
There is no universal winner. Excel is better when users need detailed calculations, reconciliation, temporary modelling, direct data manipulation or ad-hoc investigation. Power BI is better when users need interactive dashboards, visual analytics, regular management reporting, multiple data sources and scalable KPI monitoring.
But for Dynamics 365 organisations the real answer goes further. A good strategy may use Excel for analysis, Power BI for insight, embedded Power BI for contextual analytics, Financial Reporting for statements, SSRS for operational documents, Business Performance Analytics for standardised analytics, Electronic Reporting for structured electronic outputs and AI-assisted analytics for conversational exploration where governance allows.
The goal is not to minimise the number of reporting technologies. It is to use the right technology for the right business requirement.
The strongest reporting environments do not force every requirement into a single tool. They establish a reliable data foundation and then give each user the reporting experience appropriate to their role. For Dynamics 365 customers, that is the difference between creating reports and building a reporting strategy.
15QuestionsFrequently asked questions
Is Power BI better than Excel for Dynamics 365 reporting?
Neither tool is universally better. Power BI is generally more suitable for interactive dashboards, trends, KPIs and management analytics. Excel is often more efficient for transaction-level investigation, reconciliation, detailed calculations and ad-hoc analysis. Most finance teams need both.
Can Power BI replace Excel?
Not completely. Power BI can replace many manually prepared dashboards and recurring management reports, but Excel remains valuable for detailed analytical and working-data scenarios where the user needs to calculate, annotate and manipulate figures directly.
Can Power BI reports appear directly inside Dynamics 365?
Yes. Dynamics 365 Finance and Operations applications support Power BI experiences within application workspaces, so users can interact with analytics in the context of the business process they are already performing and drill through into the underlying records.
When should Financial Reporting be used instead of Power BI?
Financial Reporting is appropriate when finance requires structured statements such as Profit & Loss, Balance Sheet, Budget versus Actual or similar row-and-column financial reports where the structure itself must stay consistent every period.
What is SSRS used for in Dynamics 365?
SSRS supports operational and precision-layout reporting: transactional reports, business documents such as invoices and packing slips, scheduled reports and any output where format, parameters and transaction detail are central to the requirement.
What is Business Performance Analytics?
Business Performance Analytics is a Dynamics 365 Finance capability providing standardised analytical models and reports across business processes such as Record-to-Report, Procure-to-Pay and Order-to-Cash, built on Power BI data models that users can filter, slice and drill into.
Can Business Performance Analytics work with Excel?
Yes. Microsoft supports creating both Power BI and Excel reports from Business Performance Analytics, and an Excel add-in exposes the same analytical dataset used by the embedded Power BI reports — so the choice of tool does not fragment the data.
Can Copilot or AI replace Power BI reports?
Not at present, and that is not the right way to position it. Microsoft documents Dynamics 365 ERP Analytics MCP as a preview capability letting AI agents analyse Business Performance Analytics data through natural-language questions. Treat it as an additional interaction layer over trusted data, not a replacement for governed financial reports.
How many reporting tools should one organisation use?
As many as the requirements genuinely need. Using five reporting technologies is not a failure if each is solving the correct problem. The failure mode is the opposite: forcing statutory statements, printed documents and reconciliation work into a dashboard tool because it was chosen first.
What is the first step in a reporting review?
Establish who needs the information and what decision they will make with it. Only then does the question of Power BI, Excel, Financial Reporting or SSRS become answerable.
Planning Your Dynamics 365 Reporting Strategy?
If your organisation depends on multiple Excel reports, duplicated dashboards, manually prepared management packs or reporting outputs nobody wants to maintain, the first step is to assess the complete reporting landscape — and decide which technology each requirement actually belongs in.